Many questions in the 2023-24 Religious Landscape Study (RLS) previously were asked in the 2007 and 2014 landscape studies. Measuring change over time on these questions is one key goal of the new RLS.
But the 2023-24 survey was conducted using different methods from the 2007 and 2014 surveys, and this “mode switch” complicates comparisons between the results of the new survey and the findings of the previous surveys.
In the new survey, we mailed invitations to a random sample of U.S. households using address-based sampling (ABS). Participants were given the option of completing the survey online, on paper, or on the phone (by calling a toll-free number we gave them). For more details, read this report’s Methodology. Overall, 60% of the respondents in the 2023-24 RLS participated online, 37% completed the survey on paper, and 3% took the survey on the phone.
By contrast, both the 2007 and 2014 surveys were conducted entirely by phone. In both of those surveys, we recruited respondents using random-digit dialing, and the survey was administered by live interviewers who asked the questions and recorded the answers.
Respondents answer some survey questions differently when they are talking with an interviewer (as in the 2007 and 2014 surveys) than when they participate in surveys online or on paper (as most respondents in the new survey did). This means that for some survey questions, the results we obtained in previous surveys (using an interviewer-administered mode) cannot be directly compared with the results from the new survey that we conducted using mainly self-administered modes, even if the wording of the questions is identical.
But not all questions are equally subject to these “mode effects.” While testing indicates that some questions are not comparable across different modes, others can be safely compared, and still others fall somewhere in between – the data can provide basic information about the direction of trends, even if varying modes don’t produce identical results.
Using a bridge study and other data to decide how to compare results
To help us determine which results from the new survey are comparable with those of past surveys, we conducted a telephone bridge study using a methodological approach similar to the one we used for the 2007 and 2014 landscape studies. In the bridge study, we used a random-digit-dialing method and conducted telephone interviews with 1,519 respondents separately from the main survey. We asked these respondents the same questions that were administered to respondents in the main survey. But the 1,519 respondents in the telephone bridge study are not included in the main RLS survey; the bridge study was conducted only as a test, exclusively for the purpose of helping us determine which questions in the new survey can safely be compared with the 2007 and 2014 results, which questions clearly cannot be compared, and which fall somewhere in between. (Read about the bridge study’s Methodology.)
We compared the results of the telephone bridge study with those of the main address-based sample. For each question, we examined whether the balance of opinion was similar across the differing modes (phone for the bridge study, mostly online/paper for the main survey). We also considered whether the different survey modes led to different distributions on particular response options. For example, people who completed the survey by phone in the bridge study sometimes volunteered “I don’t know” as a response, an option that is not available to respondents on the web and mail surveys. This sometimes resulted in fewer phone respondents choosing one of the substantive response options, compared with those who completed the survey via other modes.
The bridge study is one important tool we used to help determine how to compare the results from the 2023-24 RLS with the results from the previous landscape studies, but it is not the only tool we used for this purpose. In addition to the bridge study, we also used other Pew Research Center analyses and experiences to help inform our decisions about whether to make comparisons between the new survey and previous RLS results. For example, we conducted an analysis in 2021 assessing whether it is possible to compare phone results with web results on key questions about religious identity, frequency of prayer, religious service attendance, and religion’s importance in people’s lives. Several RLS questions also have been asked on other recent Center surveys, which can provide additional information about comparability.
We drew on all this information – the telephone bridge study, previous efforts to understand mode effects, and ongoing Pew Research Center surveys – to categorize RLS questions into three buckets, color coded as green (“go”), yellow (“caution”) and red (“stop”).
Green questions produce results in the new survey that can safely be compared with the 2007 and 2014 RLS findings. There is no evidence that these questions are subject to significant mode effects. In polling lingo, they are “trendable” even though the new RLS was conducted using different modes than the previous studies.
Red questions cannot be compared with the previous studies. The mode effects on these questions are relatively large. Comparing the results of these questions from the new study with previous studies could be misleading. Doing so might suggest that big changes have occurred in public opinion over the last 10 or 15 years when, in reality, the different results could be produced by the mode switch alone.
Yellow questions fall between the safely trendable green questions, on the one hand, and the clearly non-trendable red questions, on the other. Yellow questions appear to be subject to modest mode effects, but they nevertheless can be cautiously compared with previous results while bearing in mind the size and direction of the mode effects on the particular question at hand.
Green: Questions we can compare with previous Religious Landscape Studies
Many key questions in the new RLS can be safely compared with the 2007 and 2014 landscape studies, including the study’s core questions about religious identity (also sometimes called religious affiliation, preference or adherence). The bridge study finds little evidence that people answer questions differently on the phone than online/on paper when asked about their current religious identity, their childhood religious identity, or the religious identity of their spouse/partner.
The bridge study yielded somewhat fewer Catholic respondents than the main survey. And among respondents who are married or living with a partner, the bridge study finds a slightly smaller share who say their spouse/partner is religiously unaffiliated. Otherwise, though, the religious composition of respondents in the bridge study was quite similar to the religious composition of respondents in the main survey. Additionally, prior Center analysis found that questions about religious identity can be safely compared between interviewer-administered and self-administered surveys (assuming there are no other differences).
The new survey’s questions about prayer frequency can also be safely compared with the prior studies. The percentage of people who say they pray daily is somewhat higher in the telephone bridge study than in the main survey (by 3 percentage points), and the share of people who say they seldom or never pray is somewhat lower in the bridge study than in the main survey (by 4 points). However, previous Center analysis found little difference in answers to this question between a telephone survey and self-administered surveys. And both the main survey and the companion bridge study suggest that the share of Americans who pray daily has declined since 2014.
Several questions in the RLS ask respondents about personal characteristics, like their age and race. Many of these demographic variables are used to “weight” the survey data to known parameters derived from the U.S. Census Bureau, to make sure that the survey’s sample is representative of the country’s broader population. These kinds of demographic traits are mostly safe to compare with the previous RLS findings.
Here is the complete list of “green” questions that can safely be compared between the new RLS and the previous surveys (refer to the Topline for full results):
- RELIG-BRANCH (Questions about the respondent’s current religion – Protestant, Catholic, etc.)
- PRAY (How often do you pray?)
- BORN (Asked of Christians – Do you think of yourself as a born-again or evangelical Christian?)
- CHRELIG/CHA3/CHBORN (Questions about the respondent’s religious upbringing – Were you raised Protestant, Catholic, etc.?)
- SPRELIG/SPA3/SPBORN (Asked of people who are married or living with a partner – Questions about the religious identity of one’s spouse/partner)
- RACECMB/HISP (Race/ethnicity of the respondent)
- EDUC_ACS (Highest level of educational attainment; trendable to the 2014 survey but not the 2007 survey, which asked a different question about education)
- YOBMOD (Used to determine the respondent’s age)
- NATIVITY/FTHR/MTHR (Summary of information about whether the respondent and the respondent’s parents were born inside or outside of the U.S.)
- HH1/HH3 (Household size, including how many are ages 18 or older)
- FERT (How many children have you ever had?)
- MARWHEN (Asked of married people – In what year did you get married?)
- CITIZEN (Are you a citizen of the United States?)
- HAPPY (How happy are you with your life these days?)
- CHNG_b (Is having more women in the workforce a change for the better or for the worse?)
- KIDACT_c (Asked of parents of minor children – Do you homeschool or send children to private religious school?)
Red: Questions we cannot compare with previous Religious Landscape Studies
There are several questions in the 2023-24 RLS that we cannot compare with our previous landscape studies, even though the wording is the same.
When respondents complete surveys by directly talking to another person, they sometimes give more socially desirable responses or avoid potentially controversial responses. This is called “social desirability bias.” The results of the bridge study suggest that this bias may have played a role in responses to some questions.
For example, on a question about whether the country’s growing immigrant population has been a change for the better, a change for the worse, or hasn’t made much difference, the share of U.S. adults who say “change for the worse” is 15 points lower in the telephone bridge study than on the main survey. It seems that completing the survey by talking to another person over the phone may lead some respondents to avoid giving a negative opinion about the growing immigrant population.
The bridge study and previous Pew Research Center analyses also show that the share of people who say they often attend religious services is higher in telephone surveys than in self-administered surveys. As a consequence, the results of our 2023-24 RLS question about frequency of religious attendance cannot be compared with those of the 2007 and 2014 studies.
On other questions, we cannot compare results because the percentages who say they “don’t know” in the phone-based bridge study are significantly higher than in the main study. For example, on a question about political party identification, the share of respondents who say they don’t know or who don’t answer the question is 5 points higher in the bridge study. And in a follow-up question asking those who do not identify as Republicans or Democrats whether they lean Republican or Democratic, the share who say they don’t know or who decline to answer is also higher in the bridge study. Ultimately, the share of respondents who don’t identify with or lean toward either political party is 14 points higher in the bridge study than in the main survey.
Some questions are subject to potential “context effects,” suggesting they may not be comparable with previous instances in which the same question appeared in a different context. For example, the distribution of responses to the 2023-24 survey’s question about the size of the government (asking whether respondents would prefer a bigger government that provides more services or a smaller government that provides fewer services) is very different in the new survey (which finds more support for a bigger government than for a smaller one) than in other Center surveys (which find a relatively even split). In the new RLS, responses to this question might have been influenced by asking it immediately after a question on whether the government provides too little, too much, or about the right amount of assistance to people in need. In the prior RLS, this question was asked in a more neutral context, and so we have decided not to compare the new findings with the old findings.
Finally, we cannot directly compare results about income levels. On all of the surveys, we ask respondents about their total household income. But because our analysis does not adjust for inflation, the value of a $40,000-$50,000 household income, for example, is different today than it was in 2007 or 2014.
Here is a list of the RLS questions we have coded as “red,” meaning they are not comparable with the earlier studies, even though those earlier studies included similar or identical questions (in the survey’s Topline, we show only the 2023-24 results on red questions and not the prior results, since they are not trendable):
- ATTNDPERRLS (Frequency of attendance at religious services)
- PARTY/PARTYLN (Political party identification)
- IDEO (Are your political views conservative, moderate or liberal?)
- CHNG_a (Whether a growing population of immigrants is a change for the better or for the worse)
- QB2d (Whether there are absolute standards of right and wrong)
- GOVSIZE1 (Whether the respondent prefers a bigger government or a smaller government)
- PRAC_b (Frequency of scripture reading)
- EXP_a (Frequency of feeling a deep sense of spiritual peace/well-being)
- EXP_b (Frequency of feeling a deep sense of wonder about the universe)
- EXP_c (Frequency of feeling a deep sense of gratitude)
- EXP_g (Frequency of thinking about the meaning/purpose of life)
- KIDACT_a (Asked of parents of minor children – Do you pray/read scripture with your children?)
- KIDACT_b (Asked of parents of minor children – Do you send your children to a religious education program?)
- INC_SDT1 (Household income)
- ORIENTMOD (Sexual orientation)
Yellow: Questions we can cautiously compare with previous Religious Landscape Studies
Finally, there are some questions that produce results that can be compared with previous surveys, as long as the comparisons are done cautiously.
One category includes “balanced choice” questions in which the main study and the phone-based bridge study get similar results for one of the substantive response options (typically the affirmative option), but slightly different results on the other substantive response option, often due to larger shares of “don’t know” responses and refusals to answer the question on the phone. For example, the difference between those who say “homosexuality should be accepted by society” in the main study and the bridge study is less than 1 point. However, the share of respondents who say they don’t know or who don’t answer the question in the bridge study is 7 points higher than in the main survey. And the share who say “homosexuality should be discouraged by society” is 7 points lower in the bridge study than in the main survey. In other words, the share of respondents who say “homosexuality should be accepted by society” can be safely compared with the prior studies, but the share who say it “should be discouraged” cannot.
Other questions that fall in this category (having similar results on one substantive response option) ask about belief in heaven, belief in hell, and views of churches and religious organizations.
On some questions, responses differ in the degree to which they affirm a response, but the total share who affirm the response, regardless of degree, is similar. For example, on a question about the legality of abortion, the share who say it should be “legal in all cases” is 3 points lower in the bridge study, but the share who say it should be “legal in most cases” is 5 points higher in the bridge study. Taken together, the total share of respondents who say abortion should be legal in all or most cases is just 2 points higher in the bridge study than in the main survey. In our analyses comparing the new survey’s findings with past surveys, we focus on this net share – those who say abortion should be legal all or most of the time.
Here is a table that lists the questions we have deemed “yellow” – cautiously trendable – with a brief explanation of some points readers should keep in mind when interpreting the trends on these questions. In the survey Topline, these questions are all clearly labeled as yellow, and the 2007 and 2014 results are described as “trends for comparison.”
‘Yellow’ trend questions
| Question label | Considerations for interpreting trends |
|---|---|
| QB2a | This question asks whether homosexuality should be “accepted by society” or “discouraged by society.” The share saying “accepted” is very similar in the main survey and the telephone bridge study, and can be safely compared with results from 2007 and 2014. However, the share saying “discouraged” is higher in the main survey than in the telephone bridge study, and the share who don’t provide an answer is lower in the main survey than in the bridge study. These categories (“Discouraged” and “No answer”) should not be compared with the 2007 or 2014 results. |
| QB2c | This question asks whether stricter environmental regulations “cost too many jobs and hurt the economy” or are “worth the cost.” The share saying “cost too many jobs and hurt the economy” is slightly higher (by 3 points) in the main survey than in the telephone bridge study, as is the share saying “worth the cost” (by 2 points), while the share who don’t answer the question is lower in the main survey than in the bridge survey (by 6 points). Readers should exercise caution when comparing the absolute value of the substantive responses with the prior studies, but the balance of opinion (more support for “worth the cost” option) is the same in both the main survey and the bridge study. |
| ABRTLGL | This question asks whether abortion should be “legal in all cases,” “legal in most cases”, “illegal in most cases,” or “illegal in all cases.” The share saying legal in all cases is somewhat higher in the main survey than in the bridge study (by 3 points), but this is offset by the lower share of respondents in the main survey who say legal in most cases (lower than the bridge study by 5 points). The combined share who say abortion should be legal in all/most cases is similar in the main survey and the bridge study, and can be safely compared with the 2007 and 2014 results. However, the combined share saying abortion should be illegal in all/most cases is higher in the main survey than in the bridge study (by 6 points), and the share expressing no opinion is lower in the main survey than in the bridge study (by 5 points). These response options (“Net Illegal in all/most cases” and “No answer”) should not be directly compared with the 2007 and 2014 results. |
| GAYMARR | This question asks respondents whether they strongly favor, favor, oppose, or strongly oppose allowing same-sex couples to marry legally. The combined share who say they strongly favor/favor same-sex marriage is very similar in the main survey and the bridge study, and can be compared with the 2014 results (this question was not asked in the 2007 survey). However, the combined share who say they strongly oppose/oppose same-sex marriage is somewhat higher (by 5 points) in the main survey than in the bridge study, while the share who express no opinion is 6 points lower in the main survey than in the bridge study. These response options (“Strongly oppose/Oppose” and “No answer”) should not be directly compared with the previous results. |
| RELIMP | This question asks respondents how important religion is in their lives. The share of respondents who say it is “very important” is lower in the main survey than in the bridge study (by 6 points). Additionally, the share of respondents who say very important is lower in the main RLS survey than in other recent Center surveys, suggesting the context in which this question was asked in the RLS (after an extended series of questions about religion/spirituality) may have had an effect on responses to this question. Comparisons between the new results and the prior landscape studies should be made cautiously and with these considerations in mind. Refer to Chapter 7 for additional discussion of these issues. |
| MEMB | This question asks respondents whether they are members of a religious congregation. The results from the main survey are similar to the bridge study, suggesting there is no mode effect on this question. However, the wording of the question is somewhat different in 2023-24 than it was in 2014, and so the trend should be interpreted with some caution. |
| GOD/GOD2 | These questions ask respondents whether they believe in God or a universal spirit, and then (in a follow-up question) how certain they are about their belief. The share who say they believe in God/a universal spirit with absolute certainty is similar in the main survey and in the bridge study, as is the share who say they believe in God/a universal spirit but are not absolutely certain. These categories can be safely compared with the 2007 and 2014 results. The share who say they do not believe in God/a universal spirit is higher in the main survey than in the bridge study (by 4 points), and should not be compared with the previous results. However, both the main survey and the bridge study suggest that the share who do not believe in God or a universal spirit is higher now than in 2007. (The share expressing no opinion is slightly lower in the main survey than in the bridge study.) |
| HVN | This question asks respondents whether they believe in heaven. The share saying yes is similar in the main survey and the bridge study, and hence can be safely compared with the 2007 and 2014 results. However, the share saying no is higher in the main survey than in the bridge study, while the share expressing no opinion is lower in the main survey than in the bridge study. These response options (“No” and “No answer”) should not be compared with the previous results. |
| HLL | This question asks respondents whether they believe in hell. The share saying yes is similar in the main survey and in the bridge study, and can be safely compared with the 2007 and 2014 results. However, the share saying no is higher in the main survey than in the bridge study, while the share expressing no opinion is lower in the main survey than in the bridge study. These response options (“No” and “No answer”) should not be compared with the previous results. |
| PRAC_a | This question asks respondents how often they participate in prayer groups or scripture-study groups. The share saying “at least once a week” is slightly lower in the main survey than in the bridge study (by 3 points), as is the share saying “once or twice a month” (also by 3 points). Meanwhile, the share saying “never” is higher in the main survey than in the bridge study (by 4 points). However, both the main survey and the bridge study suggest that the share who do this weekly has declined, while the share who never participate in these kinds of groups has risen. That is, in these categories (“Weekly” and “Never”), the difference between the main survey and the bridge study on this question is appreciably smaller than the difference between the main survey and the 2014 findings. Thus, it is reasonable to conclude that the share of adults who participate weekly in prayer groups or scripture-study groups has declined since the 2014 RLS, although not necessarily by the full amount of the difference seen in results. |
| MARITAL | This question asks respondents about their current marital status. The share of respondents in the main survey who are married is in line with U.S. Census Bureau estimates. But the share of married respondents is substantially higher in the main survey than in the bridge study, and so comparisons between the new survey and previous estimates of the shares of people in various religious groups who are married should be made with caution. |
| CHILDREN | This question asks respondents whether they are the parent or guardian of any children under the age of 18 living in their home. Fewer respondents say no (by 4 points) in the main survey than in the bridge study, while the share who say yes and the share who decline to answer are each slightly higher in the main survey than the bridge study. |
| RELINSTa-g | These six questions ask respondents whether they agree or disagree with each of six statements about religious organizations. Three statements are positive (e.g., “religious organizations protect and strengthen morality in society”) and three are negative (e.g., “religious organizations focus too much on rules.”) On four of the six questions, the shares who say they agree are similar in the main survey and the bridge study. On the other two questions (asking whether religious organizations “bring people together and strengthen community bonds” and whether religious organizations “play an important role in helping the poor and needy”), the shares of respondents saying they agree are somewhat lower in the main survey than in the bridge study (by 5 points and 4 points, respectively). On these two items, both the main survey and the bridge study suggest that the shares who agree have declined over time. And so we think it is safe to cautiously compare the share expressing agreement in the new survey with the shares expressing agreement in the previous surveys. However, the shares expressing disagreement are higher in the main survey than in the bridge study on all six items, and the shares expressing no opinion are lower in the main survey than in the bridge study on four items. Thus, we recommend against drawing direct comparisons between the new survey and the previous surveys on these response options (“Disagree” and “No answer”). |
| GENDER | The 2023-24 survey includes the following question: “Do you describe yourself as a man, a woman, or in some other way?” This approach to measuring gender is different from both the 2007 and 2014 surveys. In the 2007 survey, respondents were not directly asked about their gender; rather, the telephone interviewers were asked to use their judgment to determine whether each respondent was a man or a woman, and to record this judgment at the end of the interview. In the 2014 survey, respondents were asked, “Are you male or female?” If they declined to answer or volunteered another response, the respondent’s gender was recorded based on the interviewer’s observation. Despite these differences in measurement approaches, we think basic comparisons of the gender composition of religious groups (especially the ratio of men to women) can be made cautiously. |
PEW RESEARCH CENTER
Bridge study methodology
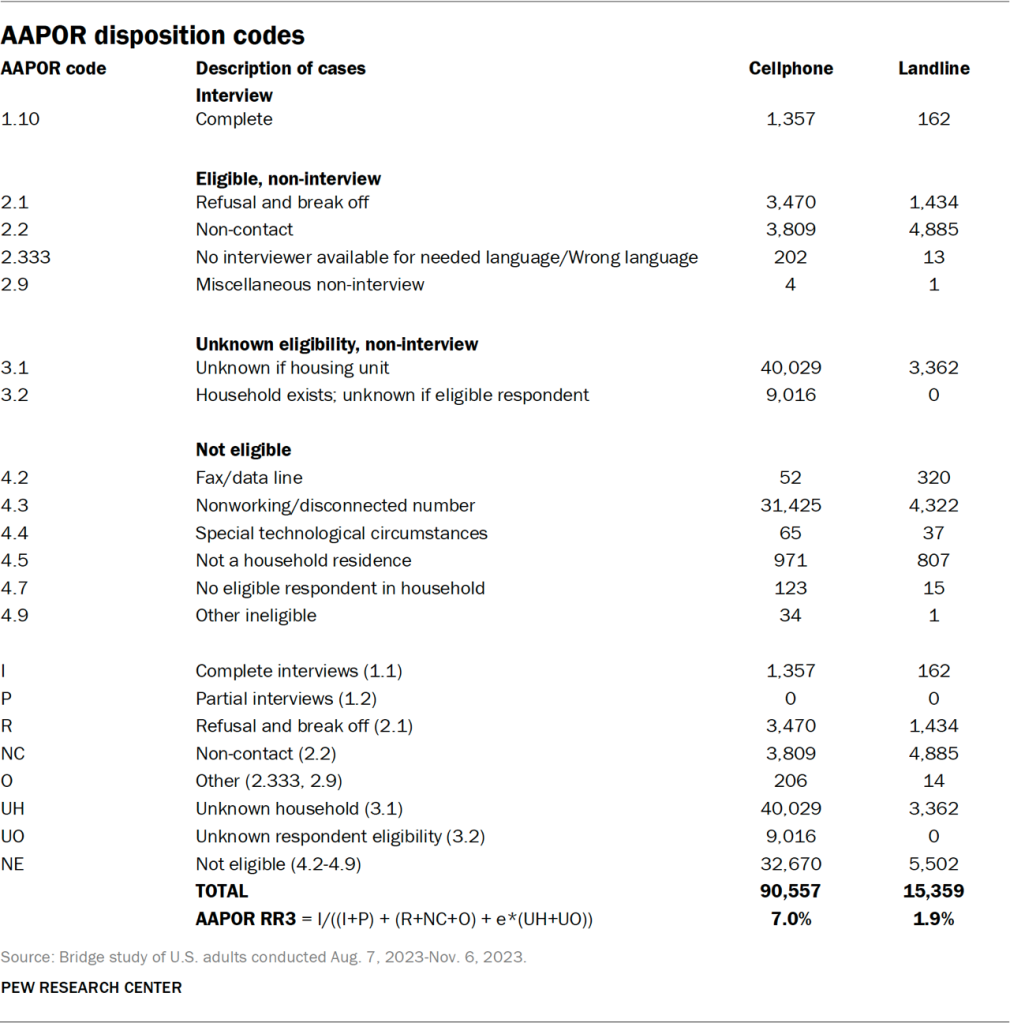
The bridge study was conducted by telephone in English and Spanish from Aug. 7 to Nov. 6, 2023, among a nationally representative sample of 1,519 U.S. adults. Of those, 1,357 were completed via cellphone and 162 via landline telephone. Like the main RLS, the bridge study was conducted for Pew Research Center by NORC at the University of Chicago.
Both the cellphone and landline samples were provided by Marketing Systems Group (MSG). Sampled numbers were dialed up to five times by an interviewer to attempt to complete the survey.
After accounting for the complex sample design and loss of precision due to weighting, the national margin of sampling error for the bridge study is plus or minus 3.3 percentage points at the 95% level of confidence.
The research plan for the RLS – including the bridge study – was submitted to NORC’s institutional review board (IRB), which is an independent committee of experts that specializes in helping to protect the rights of research participants. This research was declared exempt under category 2 of IRB code (approval #: FWA 00000142).
Sample design
The bridge study employed a dual-frame (cellphone and landline) random-digit-dialing (RDD) approach to yield a nationally representative sample to produce national estimates. Unlike the primary RLS study, it was not designed to produce state or metropolitan statistical area-level estimates.
Both frames (cellphone and landline) were stratified by census region to account for differential nonresponse. A total of 122,118 cellphone numbers and 89,017 landline numbers were drawn with the aim of yielding at least 10% of interviews from the landline sample.
The cellphone sample was drawn by MSG, using their Cell-WINS activity flags. The Cell-WINS service appends activity code information to each sampled record, flagging inactive and business cellphone lines. Any number determined to be inactive or a business was discarded prior to data collection and is not included in the sample counts in this report.
The landline sample was also drawn by MSG from 1+ 100 banks and prescreened to flag business numbers. These numbers were not dialed but are included in the sample as not eligible.
Data collection
Sampled telephone numbers that were not removed during prescreening were called as many as five times in an effort to obtain a completed interview. Calls were staggered over times of day and days of the week to maximize the chance of making contact with potential respondents.
In the landline sample, interviewers asked to speak to the adult in the household with the next birthday. In the cellphone sample, interviews were conducted with the person who answered the phone provided that the person was age 18 or older. All respondents were offered a $10 gift card if they completed the survey.
While the bridge study mimicked the main RLS questionnaire, several questions were cut from the bridge study. Telephone interviews generally take longer to complete than web or paper interviews, and the cuts were made to keep the bridge study as short as possible. The omitted questions included those that had not previously been asked in prior iterations of the RLS and were thus not needed to assess how the results of the main survey can be compared with results from the prior landscape studies. The bridge survey took a median time of 33 minutes to complete.
Weighting
The weighting process begins with an initial base weight that accounts for each telephone number’s probability of selection from its respective sampling frame. The base weights for known eligible phone numbers were then adjusted to account for the expected proportion of eligible phone numbers among those with unknown eligibility.
For cases from the landline frame with a completed interview, the eligibility adjusted weight is multiplied by the number of adults in the household (max value of 3) to account for their probability of selection within the household. For cases from the cellphone frame, no adjustment is made as there is assumed to be only one eligible adult per cellphone.
Next, a frame membership adjustment was applied to account for individuals who live in a household with both a working landline and cellphone. Their weight was divided in half to account for their chance of selection in either frame.
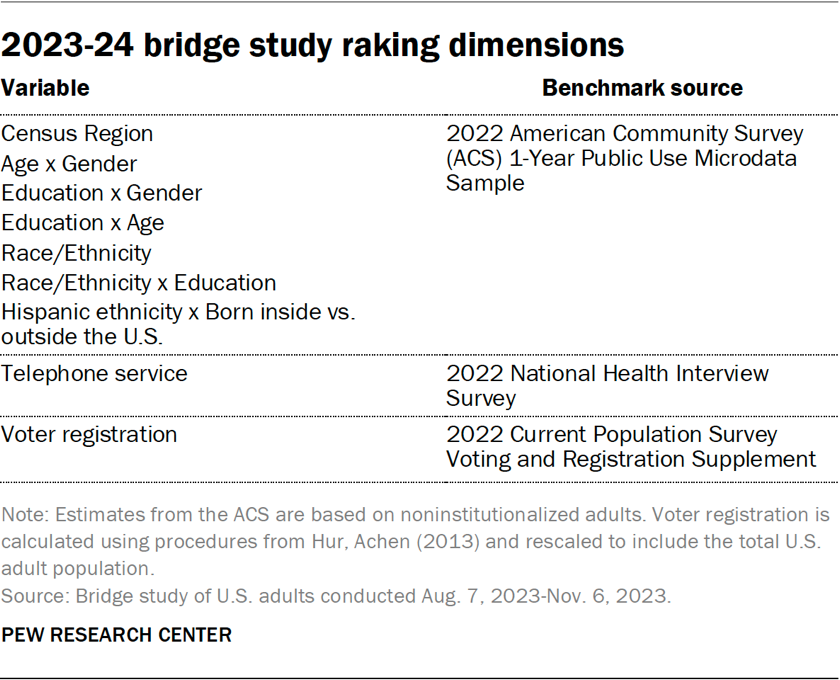
The final step in the adult weighting was to calibrate the adult weights for respondents who completed the survey, so that the calibrated weights (i.e., the estimate of the number of adults) aligned with benchmarks for noninstitutionalized U.S. adults (refer to the benchmarks listed in the accompanying table). For raking dimensions that include the cross-classification of two demographic variables, cells with fewer than 30 completed interviews were collapsed with neighboring cells to prevent the creation of extreme weight values and to ensure the convergence of the raking process.
Response rates
NORC assigned all sampled cases a result code and used these codes to compute response rates consistent with AAPOR definitions. The AAPOR RR3 response rate for the bridge study was 7.0% and 1.9% for the cellphone and landline samples, respectively.