
March brings a welcome respite from the chaos of the current political climate with its NCAA men’s Division I basketball tournament. March Madness provides an opportunity to put stressful concerns on the back burner and delve into the mysteries of brackets, the aesthetics of breakaways and the heart-stopping unease of buzzer-beaters.
But the NCAA tournament is not just fun and games for the schools involved; the stakes can be high. Beyond earning bragging rights, schools with triumphant teams can expect increases in both applications and donations. And a small number of players, having demonstrated amazing feats of agility, coordination and speed, can make it to the NBA draft.
Still, for the rest, basketball is only a sideshow to the serious business of higher education. College is about many things (yes, including sports), but one of the most important contributions America’s universities make to society is helping students move up the ladder of economic success.
Central to the American Dream is the belief every generation should do better financially than the previous one and that even low-income students should have a shot at moving up in the world. Despite everything that’s happening, most Americans expect colleges to serve as engines of economic growth and personal improvement.
So how well do the universities whose names are emblazoned on the players’ jerseys excel at helping their students move up the income ladder?
For the last eight years, we have taken the opportunity, while Americans are debating which are the best teams on the court, to examine which of the participating colleges are best at assisting their students in doing well economically after they graduate.
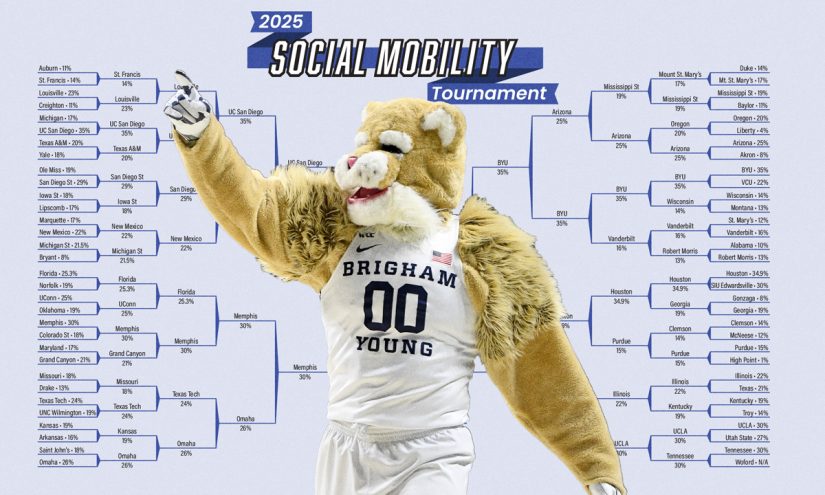
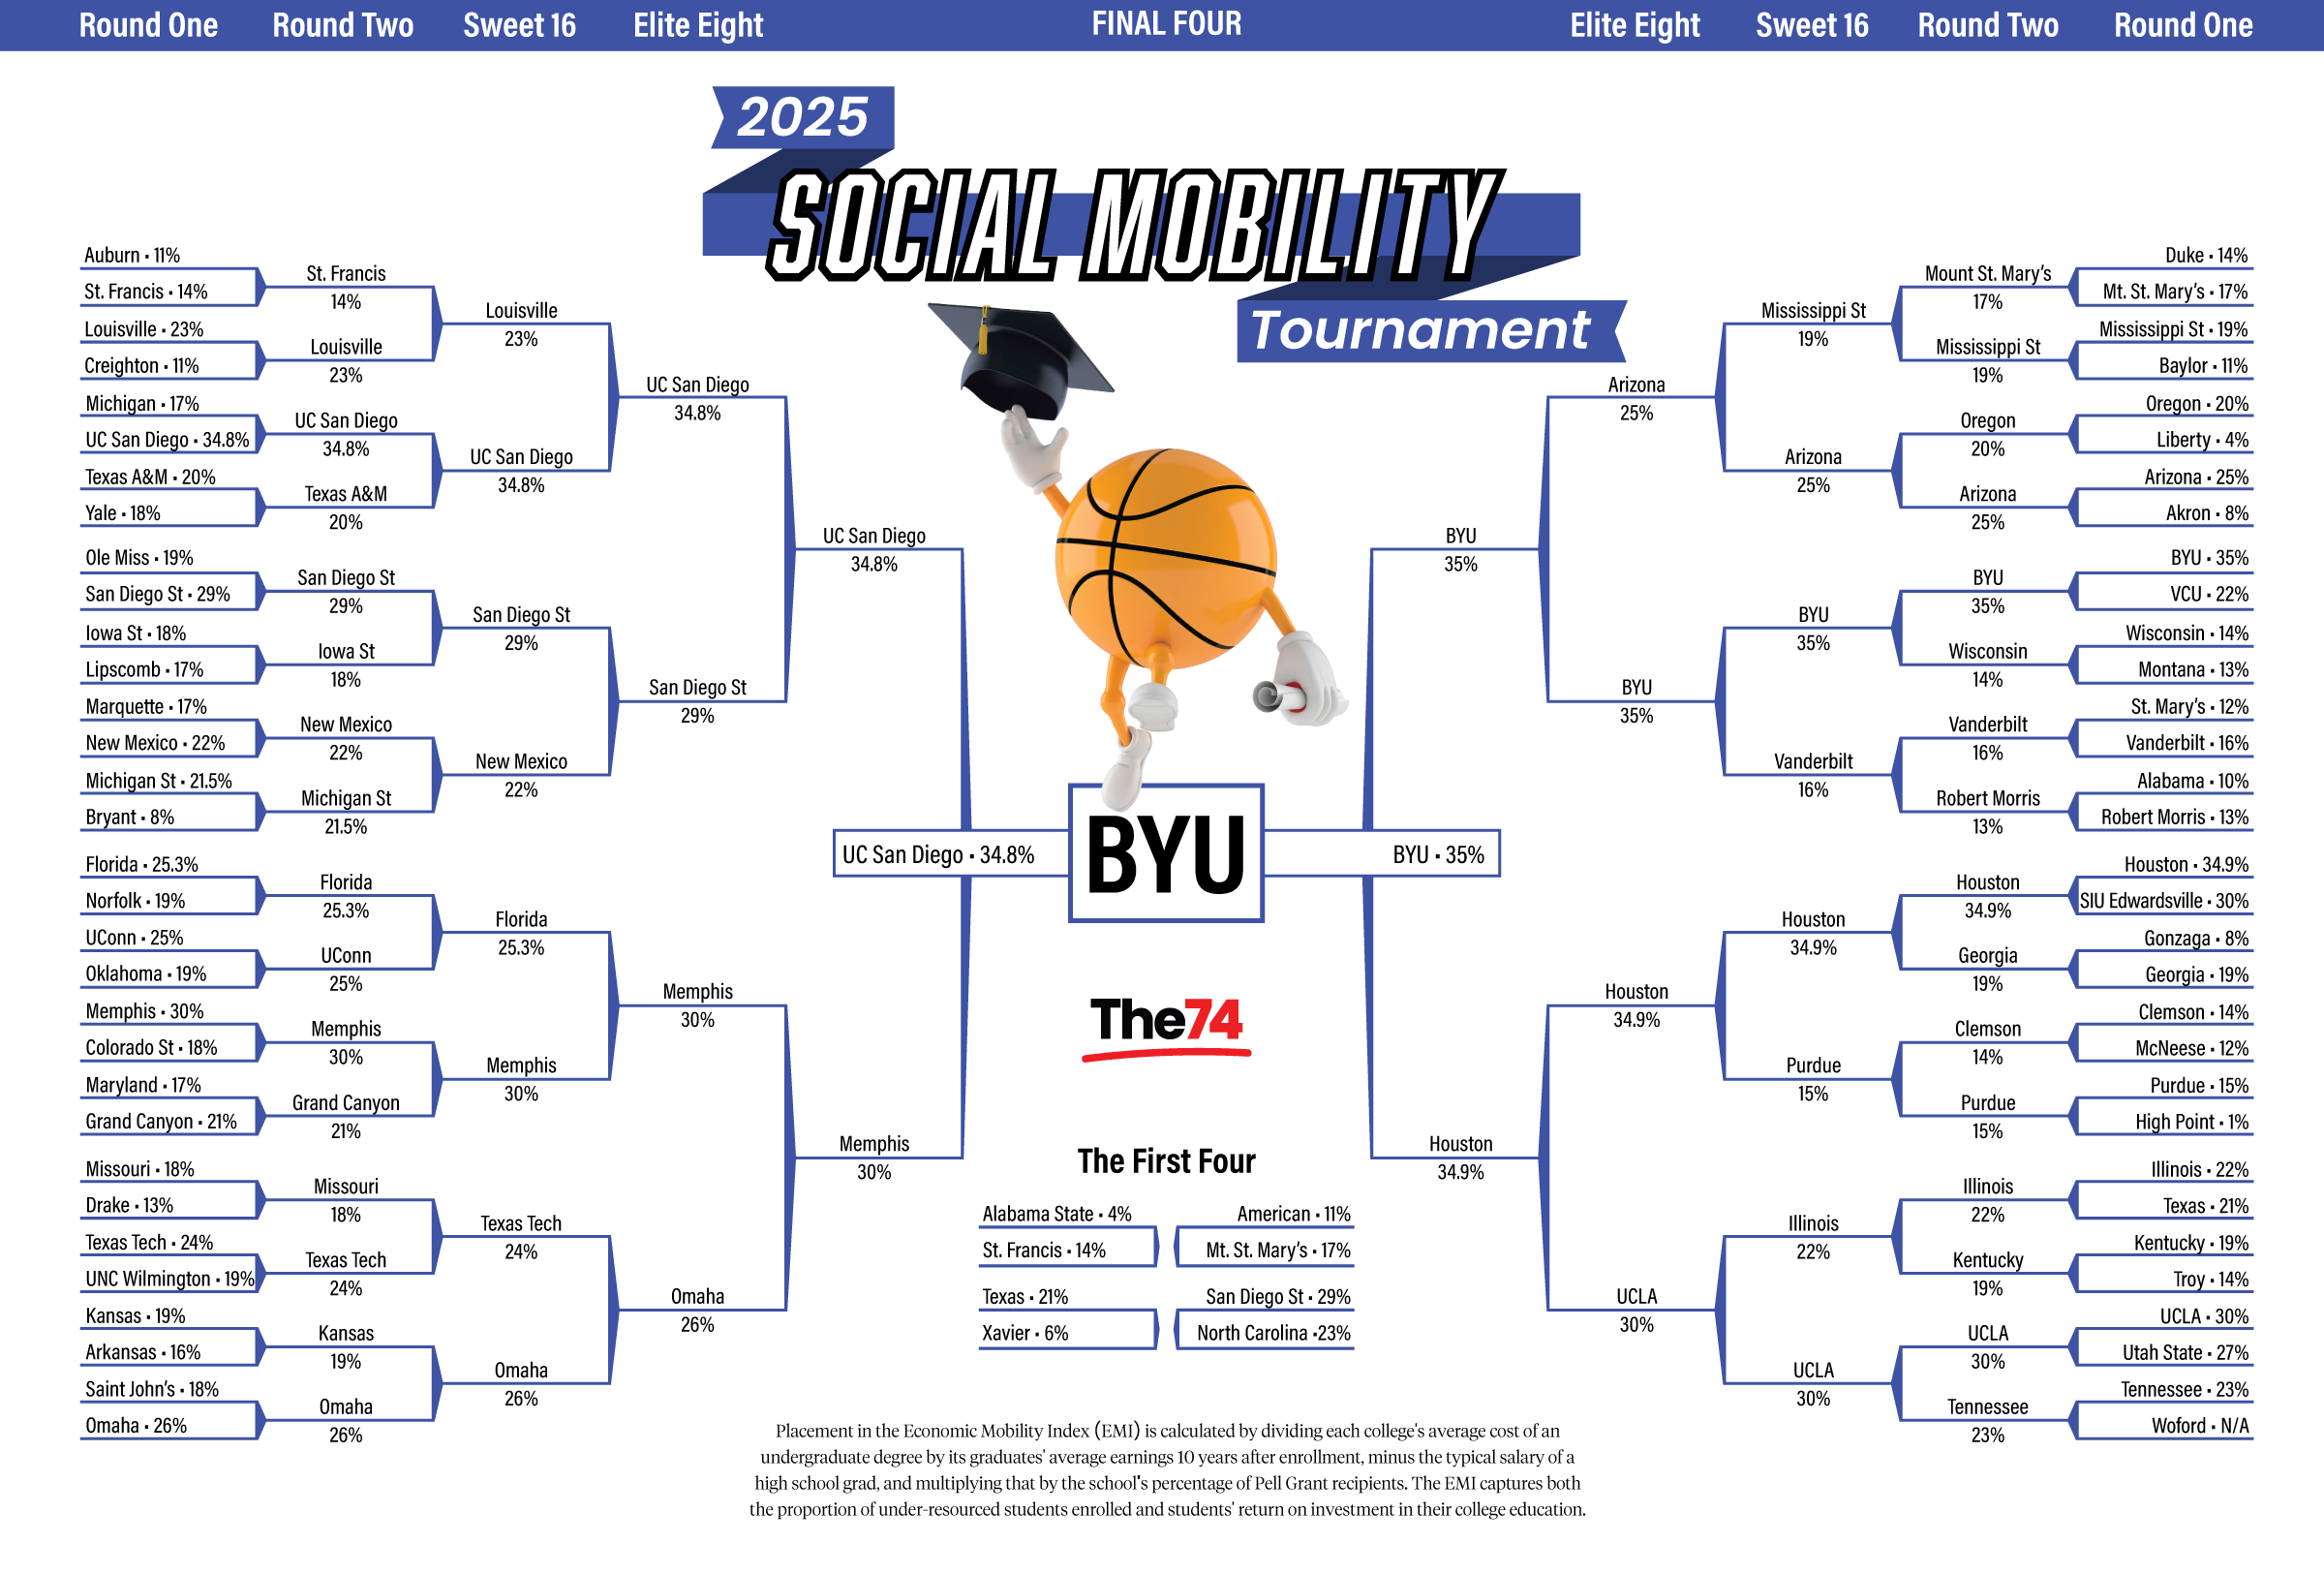
Each year, we have constructed a parallel Social Mobility Tournament Bracket, plotting how well or how poorly the colleges participating in the national tournament do in helping to place students on a path leading to the American Dream of upward mobility.
From 2017 to 2022, we constructed our bracket by comparing the tournament’s colleges according to how many of their low-income students were earning family-sustaining earnings by their early 30s. In 2023, we shifted to comparisons that take into consideration college access, affordability and post-graduation earnings — that is, the issues that are top of mind for today’s students, parents and policymakers.
As we noted last year, present-day families and legislators want to know which colleges are worth their tuition cost in time and money; how long a student will have to work to pay off that cost; and what proportion of each college’s under-resourced students is being placed on the path to financial security.
To account for these concerns, we have turned to the Economic Mobility Index (EMI), created by the former director of the U.S. Department of Education’s College Scorecard, Michael Itzkowitz, as source material for our bracket.
Using publicly available information from the department and the Census Bureau, this index ranks 1,320 bachelor’s degree-granting institutions by how well each provides economic mobility for its students. To do so, it first considers the return on investment that lower-income students obtain at each college by calculating the out-of-pocket costs required to obtain a four-year degree.
The index then considers the additional financial benefits students obtain by attending one of these schools. This earnings premium is the additional income graduates make in comparison to someone with only a high school diploma. In short, the lower the out-of-pocket costs and the higher the earnings premium, the quicker a student will receive a return on the investment needed to obtain the degree. Lastly, the index rewards schools for the proportion of lower- and moderate-income students it enrolls in addition to the return on investment it provides.
By considering not only the percentage of students who move up the economic ladder, but also the number of graduates qualified for federal Pell Grants, we can also assess the role each college plays in helping the nation as a whole improve social mobility for its less advantaged students.
Given that rankings on the EMI rely heavily on affordability and the percentage of underresourced students, it is no surprise that only six private colleges made it to Round 2 in our parallel bracket.
To understand why only two of them made it to the Sweet Sixteen in our Social Mobility Tournament Bracket, consider that the average net price for a degree at these six schools is $68,500. On the other hand, a degree at the 26 public colleges that also made it to Round 2 costs only $39,000, a nearly 44% discount.
That said, the real surprise in our bracket this year is that a private university, Brigham Young, won the championship. The BYU Cougars, a 21 seed in the NCAA tournament, ranked 66 out of the 1,320 colleges in the EMI. Their graduates enjoy a price-to-earnings premium that allows them to pay down the total net cost of their degree in less than a year.
Our Social Mobility Tournament runner-up, UC-San Diego, is not far behind. The Tritons, the 47th seed in the NCAA tournament, rank 68 in the index and also manage to pay back the cost of their degree in less than a year.
Indeed, the other two schools making up our Final Four, the universities of Houston and Memphis, are also worthy of great praise. The former ranks 67 in the index, with its Cougars able to pay back their education in less than two years. Meanwhile, Memphis ranks a very respectable 130th in the index, with its Tigers taking only three years to pay back the cost of their degree.
Whichever school takes home the NCAA tournament trophy will rightly celebrate its prowess on the court and will likely reap the benefit of increased applications. In contrast, little to no acclaim will accrue to schools whose primary merit is their ability to help students reach family-sustaining wages when coming out of low-income households.
Nearly 4,500 basketball players make up the pool of tournament dreamers. These athletes are drawn from among the approximately 7.5 million young men who made up the nation’s high school graduating classes during four years. This means a male high school graduate has an extremely small chance of playing on a Division I basketball team, and of these, fewer than 1 in 75 senior players will ever be drafted by an NBA team. No doubt, much is at stake for players and schools as they battle their way to the Final Four.
But much is likewise at stake for the more than 16 million students who enroll in American two- or four-year colleges. Like the Division I players, most of them are working hard to gain a solid spot in the U.S. economy. But with college graduation rates rarely surpassing 60%, the colleges and universities that manage to do well for large numbers of low-income students are far more deserving of recognition than even those schools committed to producing winning basketball teams.
In effect, the Economic Mobility Index scores matter, and schools that rank high on it should celebrate them as a source of pride. After all, as we have said over the last eight years, these are the sorts of results that should be boosting applications from the many young adults who want to enjoy not only the ephemeral pleasure of having a winning school team, but also the long-term benefits of upward mobility.
Get stories like these delivered straight to your inbox. Sign up for The 74 Newsletter