
About Pew Research Center’s Spring 2024 Global Attitudes Survey
Results for the survey are based on telephone, face-to-face and online interviews conducted under the direction of Gallup, Langer Research Associates, Social Research Centre and Verian. The results are based on national samples, unless otherwise noted. Here are more details about our international survey methodology and country-specific sample designs.
The American Trends Panel survey methodology
Results for the United States are based on surveys conducted on Pew Research Center’s American Trends Panel (ATP), a nationally representative panel of randomly selected U.S. adults. Panelists participate via self-administered web surveys. Panelists who do not have internet access at home are provided with a tablet and wireless internet connection. Interviews are conducted in both English and Spanish. The panel is being managed by Ipsos.
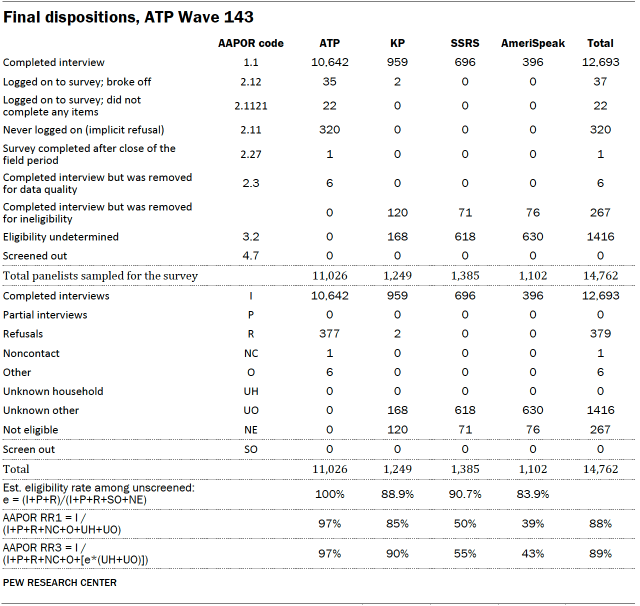
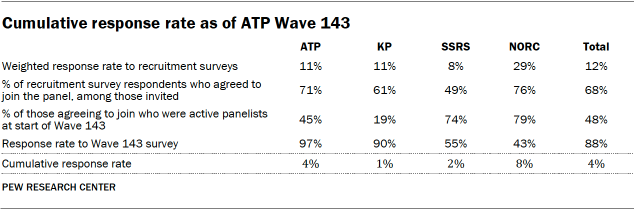
Data in this report is drawn primarily from ATP Wave 143, conducted from Feb. 13 to 25, 2024. A total of 12,693 panelists responded out of 14,762 who were sampled, for a response rate of 89% (AAPOR RR3). The survey includes an oversample of 2,051 Jewish and Muslim Americans from Ipsos’ KnowledgePanel, SSRS’s Opinion Panel and NORC at the University of Chicago’s AmeriSpeak Panel. These oversampled groups are weighted to reflect their correct proportions in the population. The cumulative response rate accounting for nonresponse to the recruitment surveys and attrition is 4%. The break-off rate among panelists who logged on to the survey and completed at least one item is less than 1%. The margin of sampling error for the full sample of 12,693 respondents is plus or minus 1.5 percentage points.
Additional survey questions were asked on ATP Wave 145, conducted from April 1 to 7, 2024, among 3,600 ATP members who had previously participated in Wave 143. Here is the methodology for Wave 145.
ATP Panel recruitment
The ATP was created in 2014, with the first cohort of panelists invited to join the panel at the end of a large, national, landline and cellphone random-digit-dial survey that was conducted in both English and Spanish. Two additional recruitments were conducted using the same method in 2015 and 2017, respectively. Across these three surveys, a total of 19,718 adults were invited to join the ATP, of whom 9,942 (50%) agreed to participate.
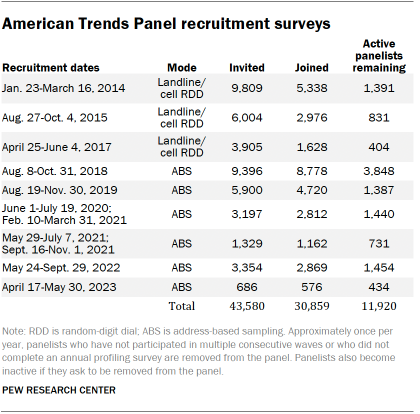
In August 2018, the ATP switched from telephone to address-based sampling (ABS) recruitment. A study cover letter and a pre-incentive are mailed to a stratified, random sample of households selected from the U.S. Postal Service’s Delivery Sequence File. This Postal Service file has been estimated to cover as much as 98% of the population, although some studies suggest that the coverage could be in the low 90% range. Within each sampled household, the adult with the next birthday is asked to participate. Other details of the ABS recruitment protocol have changed over time but are available upon request.
We have recruited a national sample of U.S. adults to the ATP approximately once per year since 2014. In some years, the recruitment has included additional efforts (known as an “oversample”) to boost sample size with underrepresented groups. For example, Hispanic, Black and Asian adults were oversampled in 2019, 2022 and 2023, respectively.
Across the six address-based recruitments, a total of 23,862 adults were invited to join the ATP, of whom 20,917 agreed to join the panel and completed an initial profile survey. Of the 30,859 individuals who have ever joined the ATP, 11,920 remained active panelists and continued to receive survey invitations at the time this survey was conducted.
The American Trends Panel never uses breakout routers or chains that direct respondents to additional surveys.
Sample design
The overall target population for ATP Wave 143 was noninstitutionalized persons ages 18 and older living in the U.S., including Alaska and Hawaii. All active panel members who completed the ATP wave which fielded from July 31 to Aug. 6, 2023 (ATP W132), or panelists who previously identified as Jewish or Muslim, were invited to participate in this wave.
The ATP was supplemented with an oversample of self-identified Jewish and Muslim American panelists from three other probability panels: Ipsos’ KnowledgePanel, SSRS’s Opinion Panel, and NORC at the University of Chicago’s AmeriSpeak panel. All panelists who met the selection criteria were selected with certainty.
Questionnaire development and testing
The questionnaire was developed by Pew Research Center in consultation with Ipsos, SSRS and NORC. The survey for ATP and KP panelists was programmed by Ipsos, while the survey for SSRS and NORC panelists was programmed by SSRS. A small number of SSRS panelists took their survey over the phone with an interviewer. Both web programs were rigorously tested on both PC and mobile devices by the Ipsos, SSRS and NORC project management teams and Pew Research Center researchers. The Ipsos project management team also populated test data that was analyzed in SPSS to ensure the logic and randomizations were working as intended before launching the survey.
Incentives
All ATP respondents were offered a post-paid incentive for their participation. Respondents could choose to receive the post-paid incentive in the form of a check or a gift code to Amazon.com or could choose to decline the incentive. Incentive amounts ranged from $5 to $20 depending on whether the respondent belongs to a part of the population that is harder or easier to reach. Differential incentive amounts were designed to increase panel survey participation among groups that traditionally have low survey response propensities.
Respondents from the Ipsos KnowledgePanel, SSRS Opinion Panel and AmeriSpeak were offered the cash equivalent of $10 for completing this survey.
Data collection protocol
The data collection field period for this survey was Feb. 13 to 25, 2024. Postcard notifications were mailed to a subset of ATP panelists with a known residential address on Feb. 12.
Invitations were sent out in separate launches. Sixty ATP panelists and 300 KP panelists were included in the soft launch, which began with an initial invitation sent on Feb. 13. The ATP and KP panelists chosen for the soft launch were known responders who had completed previous surveys within one day of receiving their invitation. All remaining ATP and KP sampled panelists were included in the full launch and were sent an invitation on Feb. 14.
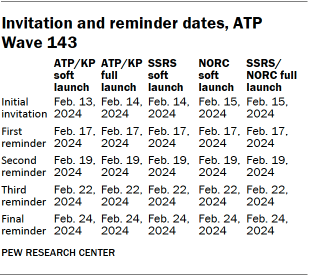
Overall, 129 SSRS panelists were included in the SSRS soft launch, which began with an initial invitation on Feb. 14. And 110 NORC panelists were included in the NORC soft launch, which began with an initial invitation on Feb. 15. All remaining SSRS and NORC sampled panelists were included together in the full launch and were sent an invitation on Feb. 15.
All panelists with an email address received an email invitation and up to four email reminders if they did not respond to the survey. All ATP panelists who consented to SMS messages received an SMS invitation and up to four SMS reminders.
Data quality checks
To ensure high-quality data, the Center’s researchers performed data quality checks to identify any respondents showing clear patterns of satisficing. This includes checking for whether respondents left questions blank at very high rates or always selected the first or last answer presented. As a result of this checking, six ATP respondents were removed from the survey dataset prior to weighting and analysis.
Weighting
The data was weighted in a multistep process that accounts for multiple stages of sampling and nonresponse that occur at different points in the survey process. First, each panelist begins with a base weight that reflects their probability of inclusion in the panel to which they belong. Separately for each of the four panels (ATP, KP, SSRS, NORC), the base weights for Muslim and Jewish respondents were scaled to be proportional to the group’s effective sample size. These weights were then combined and calibrated so that the overall proportions of Jewish and Muslim respondents respectively match the National Public Opinion Reference Survey (NPORS) benchmark.
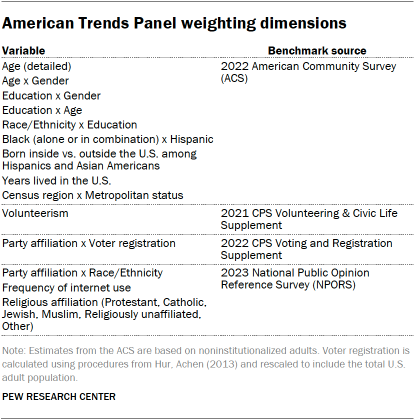
This weight is then calibrated again to align with the full set of population benchmarks identified in the accompanying table (which also includes the NPORS benchmarks for the shares of Jewish and Muslim adults). In order to reduce the loss in precision stemming from variance in the weights, the weights were trimmed separately among Jewish, Muslim, Hispanic, non-Hispanic Black and non-Hispanic Asian respondents at the 98th percentile, and among all other respondents at the 99.5th percentile. Sampling errors and tests of statistical significance take into account the effect of weighting.
The following table shows the unweighted sample sizes and the error attributable to sampling that would be expected at the 95% level of confidence for different groups in the survey.
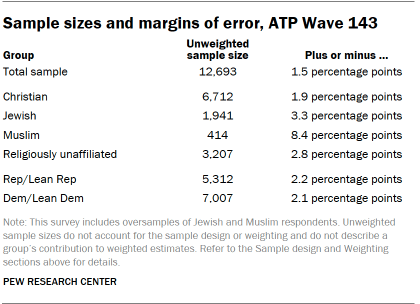
For questions asked on ATP Wave 143, this analysis reports the opinions of 6,712 U.S. Christians – slightly more than the 6,634 included in the previous analysis of U.S. data. This analysis also reports the opinions of 3,207 religiously unaffiliated adults in the U.S. – slightly more than the 3,205 included in the previous analysis. The sample size differences are attributable to small differences in the backcoding of religious identity questions across the two studies.
Sample sizes and sampling errors for other subgroups are available upon request. In addition to sampling error, one should bear in mind that question wording and practical difficulties in conducting surveys can introduce error or bias into the findings of opinion polls.
Dispositions and response rates
Analysis
We analyze respondents’ attitudes based on where they place themselves on an ideological scale, their support for populist parties, their religious identification, their educational attainment, their income and whether they live in high- or middle-income countries. We also created an index to classify people as religious nationalists. More on each of these decisions can be found below.
Ideology
Throughout the report, we analyze respondents’ attitudes based on where they place themselves on an ideological scale. We asked about political ideology using several slightly different scales and categorized people as being on the ideological left, center or right.
- In most countries, we asked people to place themselves on a scale ranging from “Extreme left” to “Extreme right.” The question was asked this way in Argentina, Bangladesh, Brazil, Canada, Chile, Colombia, France, Germany, Greece, Hungary, Israel, Italy, Mexico, the Netherlands, Nigeria, Peru, the Philippines, Poland, South Africa, Spain, Sweden, Turkey and the United Kingdom.
- In Australia, the scale ranged from “Left” to “Right.”
- In Japan, Singapore, South Korea and Thailand, ideology was measured on a scale from “Extremely progressive” to “Extremely conservative.”
- In the U.S., ideology is defined as conservative (right), moderate (center) and liberal (left).
- Ideology was not asked about in Ghana, India, Indonesia, Kenya, Malaysia, Sri Lanka or Tunisia.
Populist party support
Although experts generally agree that populist political leaders or parties display high levels of anti-elitism, definitions of populism vary. We use three measures to classify populist parties: anti-elite ratings from the 2019 Chapel Hill Expert Survey (CHES), Norris’ Global Party Survey and The PopuList. We define a party as populist when at least two of these three measures classify it as such. For more on these measures as well as which parties we classify as populist, refer to the Appendix.
Religious identification
In each country surveyed, people were asked about their current religious identification. We then analyzed religious groups with large enough sample sizes. Respondents of other religious backgrounds were not excluded from the surveys, even if their religious group was not able to be analyzed separately. In the U.S., for example, the survey included Hindus and Buddhists, though there were not enough respondents from these smaller groups to report on their answers separately.
Education
To compare educational groups across countries, we standardize education levels based on the UN’s International Standard Classification of Education (ISCED).
Income
To compare by income within countries, we create two income levels based on the approximate median income within each country. Respondents with a household income below or at the approximate country median are considered lower income. Those with an income above the approximate country median are considered higher income.
High- and middle-income countries
We classify the countries in this report as either high- or middle-income on the basis of categories from the World Bank. This is a classification we have used in multiple other Pew Research Center analyses, including when looking at global views of China, satisfaction with democracy, globalization and national identity.
High- and middle-income countries differ in myriad ways. People who live in middle-income countries are more likely to have a religious affiliation, to pray regularly and to consider religion to be important in their lives than are people in high-income countries. High-income countries are also more likely than low-income countries to be highly established democracies and to have high rates of tertiary education.
Religious nationalism index
In this report, we classify some people as “religious nationalists.” Scholars do not fully agree on how to define religious nationalism, and the challenge is even more complicated when one tries to study the concept in multiple countries – and for multiple religious groups – concurrently. For example, scholars who measure Christian nationalism in the U.S. may consider whether the government should allow prayer in public schools, while those measuring Hindu nationalism in India may consider whether the government should regulate the protection of cows, which are sacred to many Hindus.
For the purposes of making cross-national comparisons, we focused on two concepts in our definition of religious nationalism:
- How important people think identifying with the country’s historically predominant religion is for belonging – e.g., for being “truly” part of the country’s nationality
- The role people want religion to play in their country’s leader and laws
We measured these two concepts among followers of each country’s historically predominant religion using four questions:
- How important is belonging to the historically predominant religion to being truly part of your national identity? (For example, how important is being a Muslim to being truly Indonesian, or being a Christian to being truly American?)
- How important is it to you for your national leader to share your religious beliefs?
- How much influence do you think the historically predominant religion’s sacred text should have on the laws of your country? (For example, how much influence should the Quran have on the laws of Turkey, or should the Bible have on the laws of Italy?)
- When the sacred text conflicts with the will of the people, which should have more influence on the laws of your country? (This follow-up question was asked only of respondents who answered the previous question by saying that the sacred text should have a “fair amount” or “great deal” of influence on their country’s laws.)
Reliability at the country level
Before designing our measure of religious nationalism, we calculated Cronbach’s alphas to assess the reliability of these four questions. For the first three questions, which were asked of all respondents, we found the Cronbach’s alpha to be reliable at conventional levels for most countries. For example, the alpha is 0.82 in the U.S. and 0.65 or higher in most high-income countries. The alpha is lower in some middle-income countries – particularly Sri Lanka and Bangladesh.
Because the fourth question was only asked of a subset of people based on their answers to the third question, we calculate alphas that include the fourth question in two ways. One way looks at a recoded variable that combines the two questions – how much influence the historically predominant religion’s primary religious text should have and whether it should take precedence over the will of the people. Using the first two questions and the recoded variable, the Cronbach’s alpha in each country is broadly similar to those of the original analysis that included the first three questions (for example, in the U.S., the Cronbach’s alpha is 0.82).
Another way creates a binary variable where those who said the religious text should take precedence over the will of the people are coded as 1 and all others are coded as 0 – whether they received the fourth question or not. Alphas are somewhat lower using the binary variable but still remain at or above customary levels in some countries (in the U.S., for example, the Cronbach’s alpha is 0.72). Still, alphas in both of these analyses remain somewhat lower in middle-income countries.
Reliability among members of the historically predominant religion in each country
We restrict our analyses of religious nationalism to members of the historically predominant religion in each country. One reason is to ensure we are capturing people’s wishes or prescriptions rather than their observations about nationhood, which may be disaffected or angry. For example, Muslim Israelis are as likely as Jewish Israelis to say it’s very important to be a Jew to be truly Israeli. As a result, only Jewish Israelis who hold this view could be categorized as religious nationalists. (In Israel, the Cronbach’s alpha for the three questions asked of all adults is 0.61 for all Israelis but 0.71 for Jewish Israelis.)
A second reason is that our question about the leader’s religion asks the importance of a religious leader sharing your religious views. Restricting our analysis of this question only to those who share the same historically predominant religion helps us capture the dimension of religious nationalism we are most interested in. When restricted to members of the historically predominant religion, the questions remain reliable at customary levels in high-income countries.
Defining religious nationalists
Based on the investigations above, we decided not to create a combined measure through averaging across the variables. Instead, we created a measure that counts whether people take specific positions on each of the four items.
To that end, for this report, we define “religious nationalists” as people who identify with the historically predominant religion (also often the majority religion) and take a strongly religious position on all four of these questions.
In Turkey, for example, a religious nationalist would be a Muslim who says …
- Being a Muslim is very important to being truly Turkish;
- And it is very important that Turkey’s president shares their religious beliefs;
- And the Quran should have at least a fair amountof influence over Turkey’s laws;
- And when the Quran conflicts with the will of the people, the Quran should have more influence.
In Israel, a religious nationalist would be a Jew who says …
- Being a Jew is very important to being truly Israeli;
- And it is very important that Israel’s prime minister shares their religious beliefs;
- And Jewish scripture should have at least a fair amountof influence over Israel’s laws;
- And when Jewish scripture conflicts with the will of the people, Jewish scripture should have more influence.
In the United States, a religious nationalist would be a Christian who says …
- Being a Christian is very important to being truly American;
- And it is very important that the U.S. president shares their religious beliefs;
- And the Bible should have at least some influence over U.S. laws;
- And when the Bible conflicts with the will of the people, the Bible should have more influence.
We purposefully set a high bar for being counted as a religious nationalist because of the difficulty of defining the term cross-nationally. As a result, the shares identified as religious nationalists in this report may be conservative estimates. There is no country in the survey where a majority of the population is classified as religious nationalists – and in some countries, such as Germany and Sweden, it’s fewer than 1%.
Much larger shares may favor a role for religion in politics. For example, nearly a third of German Christians who are not classified as religious nationalists think the Bible should have at least “a fair amount” of influence on the laws in their country. But unless respondents expressed all four viewpoints required under our definition, they are not counted as religious nationalists.