Rare disease genomes from the 100KGP
The Health Research Authority Research Ethics Committee East of England—Cambridge South (Ref. 14/EE/111) gave ethical approval for the 100KGP. Patients with rare diseases and affected and unaffected family members were enrolled to the 100KGP through 1 of the 13 NHS Genomic Medicine Centres across England, Northern Ireland, Scotland and Wales2. Consent was obtained from all participants to the 100KGP. The recruiting clinicians assigned each proband to a specific disease (according to a hierarchical disease classification available in the project described below) and provided patient’s phenotypic data according to the HPO49. An initial cohort of 74,061 genomes (35,548 single probands and larger families) from the rare disease pilot and main programme of the 100KGP (data release v.11) was available for analysis (March 2021). Genomes were sequenced using the TruSeq DNA polymerase-chain-reaction-free sample preparation kit (Illumina) on a HiSeq 2500 sequencer, which generates a mean depth of 32× (range, 27–54) and a depth greater than 15× for at least 95% of the reference human genome. Whole-genome sequencing reads were aligned to either the Genome Reference Consortium human genome build 37 (GRCh37) for the minority of earlier samples, or build 38 (GRCh38), with the use of Isaac Genome Alignment Software. Family-based variant calling of single-nucleotide variants and insertions or deletions for chromosomes 1 to 22, the X chromosome, and the mitochondrial genome (mean coverage, 2,814×; range, 142–16,581) was performed with the use of the Platypus variant caller50. Quality control performed by Genomics England highlighted that 81 of the probands had been recruited and sequenced twice and these duplicates were removed from our cohort. In addition, the required data for our Exomiser-based gene burden analysis, for example, recruited disease category and phenotypic terms, was not available for 16 families and these were also excluded from our cohort. The demographics of the cohort, presented in Supplementary Table 1, were obtained using Labkey in the Genomics England Research Environment. Genetic ancestry inference was performed by Genomics England by principal component analysis. A random forest model was subsequently trained to predict ancestry across five super-populations (European, African, Admixed American, South Asian, East Asian), with people assigned to ancestries on the basis of a probability threshold of greater than 0.8 (https://re-docs.genomicsengland.co.uk/ancestry_inference/).
Pool of rare, putative disease-causing variants for gene burden testing
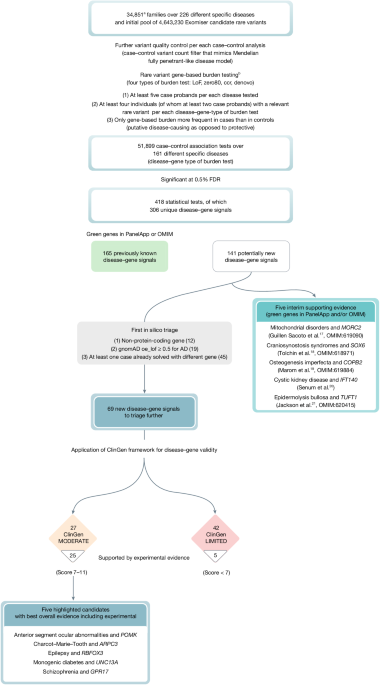
The variant prioritization tool Exomiser11 (v.12.1.0 with default settings and latest 2007* (July 2020) databases) was then run on all available 35,451 single proband and family-based VCF files to obtain a pool of rare, protein-coding, segregating and most predicted pathogenic (per gene) variants to use in an rare variant gene-based burden testing analysis for the discovery of new rare Mendelian disease–gene associations as described below. For each proband/family and each gene, Exomiser selected a single configuration of contributing variants, that is, the most predicted (REVEL and MVP) pathogenic, rare (less than 0.1% autosomal/X-linked dominant or homozygous recessive, less than 2% autosomal/X-linked compound-heterozygote recessive; using publicly available sequencing datasets including gnomAD) protein-coding homozygous/heterozygous variant or compound-heterozygote variants that segregated with disease for each possible mode of inheritance. Coding variants (including canonical splice acceptor and donor and splice region (bases one to three of exon to three to eight of intron)) were selected by Exomiser by removing all those classified as FIVE_PRIME_UTR_EXON_VARIANT, FIVE_PRIME_UTR_INTRON_VARIANT, THREE_PRIME_UTR_EXON_VARIANT, THREE_PRIME_UTR_INTRON_VARIANT, NON_CODING_TRANSCRIPT_EXON_VARIANT, UPSTREAM_GENE_VARIANT, INTERGENIC_VARIANT, REGULATORY_REGION_VARIANT, CODING_TRANSCRIPT_INTRON_VARIANT, NON_CODING_TRANSCRIPT_INTRON_VARIANT and DOWNSTREAM_GENE_VARIANT. The Exomiser analysis did not return any candidate variants for 29 families, generally for larger families with several affected people where no rare, putative disease-causing variants remained after filtering, leading to an interim dataset size of 35,422 single probands and larger families. To control for false positive variant calls and/or relatively common variants in the project itself, we further discarded variants on the basis of how often they were observed in the Exomiser master dataset itself (frequency greater than 2% for variants in a compound-heterozygote genotype, greater than 0.2% for mitochondrial DNA genome variants, greater than 0.1% for heterozygote/homozygote variants). This led us to discard data from a further 41 families. Finally, potentially digenic probands with more than one recruited disease category were discarded from the analysis, leaving a total of 35,008 probands. As part of the sample quality control, kinship coefficients were used to control for cryptic relatedness. Genomics England provided kinship coefficients only for 29,180 of the 35,008 probands. Therefore, we calculated a genetic variant overlap measure (number of variants in common in the Exomiser results for two probands per total number of variants in the Exomiser results for the two probands) for all pairwise combinations of the 35,008 probands, and demonstrated that this was correlated strongly with the available kinship coefficients (Supplementary Fig. 2). Within each recruited disease category, we then identified genetically related probands (kinship coefficient greater than 0.088 corresponding to second-degree relatives or above, or an equivalent variant overlap score (0.1) threshold where kinship coefficient was not available). The proband in the pair with the most Exomiser results (less refined list of rare, putative disease-causing variants, usually from a smaller family size) was then dropped from all further analyses. This removed 157 probands/families, leading to a final input analysis dataset of 34,851 single probands and larger families (40,402 probands and affected family members and 32,288 unaffected family members) and 4,643,230 Exomiser-based candidate heterozygote/homozygote variants and compound-heterozygote genotypes (Supplementary Table 1 and Fig. 1). Furthermore, for each case–control analysis (see case–control definition below), a further variant quality control was applied with variants seen in at least one case (as heterozygote, homozygote or in a compound-heterozygote genotype) being discarded if seen in at least one control (as heterozygote/homozygote/compound-heterozygote, homozygote/compound-heterozygote, homozygote/compound-heterozygote, respectively) to mimic a Mendelian, fully penetrant-like disease model.
Exomiser-based rare variant gene burden testing for Mendelian diseases
A rare variant gene-based burden case–control analytical framework that exploits rare, putative disease-causing variants as annotated, filtered and scored by the variant prioritization tool Exomiser was used to identify new rare Mendelian disease–gene associations. The annotation of variants to genes comes from this Exomiser analysis using its default settings to identify the most damaging consequence to the set of Gencode-basic tagged Ensembl transcripts. The framework has been described previously1 and extended in this study (https://github.com/whri-phenogenomics/geneBurdenRD). Briefly, as to the application of the analytical framework to the rare disease component of the 100KGP, cases and controls were defined exploiting the hierarchical disease classification in the project itself where the recruiting clinicians assigned each proband to any of 228 ‘specific diseases’ (level 4); the ‘specific diseases’ are in turn grouped into less specific 91 ‘disease sub-groups’ (level 3), each of which corresponds to 1 of 20 broad ‘disease groups’ (level 2) (Supplementary Table 6). Two specific diseases (pontine tegmental cap dysplasia and childhood onset leukodystrophy) were never used for recruitment in the end, leaving a final set of 226 level 4 disease categories. A case set was then defined as all probands recruited under each of the 226 level 4 disease categories and its corresponding control set as all recruited probands except those under the level 2 category containing the specific level 4 disease, for example, hypertrophic cardiomyopathy cases were compared with all non-cardiovascular disorders probands as controls. As with the gene burden testing, the gene-based enrichment of variants in cases versus controls was quantified using the cohort allelic sums test (CAST)51 statistic under four proband genotype scenarios (irrespective of the mode of inheritance): (1) presence of at least one rare, predicted LoF variant; (2) presence of at least one rare, highly predicted pathogenic variant (Exomiser variant score of at least 0.8 (either predicted LoF or missense variants predicted to be pathogenic)); (3) presence of at least one rare, highly predicted pathogenic variant in a CCR and (4) presence of a rare, de novo variant (restricted to only trios or larger families where de novo calling is possible and provided by the user). These CCR regions were defined previously by looking for the absence of variation in gnomAD15 at various levels of certainty and in the application to the rare disease component of the 100KGP we used the 95% percentile download. Given that Exomiser selects by default a single configuration of ‘contributing’ variants for each proband/family, each gene and each possible mode of inheritance as compatible with available family-based data and we calculated the CAST statistic as the best observed irrespective of the mode of inheritance, the CAST statistic corresponds to a sum test statistic40. The gene burden association is then assessed either using a binary case–control status versus the CAST statistic in a right-tailed Fisher’s exact test as in the original implementation of the analytical framework1, or using the CAST statistic as a covariate in a Firth’s logistic regression model46 that is tailored to testing unbalanced case–control datasets with rare events. In the application to the rare disease component of the 100KGP, Firth’s logistic regression models were adjusted for age, sex, family size (single proband/duos/trios and larger families) and inferred genetic ancestry (Supplementary Table 1). To maintain statistical validity and power, the analysis was limited to those disease–gene associations where an arbitrary set of at least five cases exist for the specific disease tested and, for each of the four gene-based proband genotype scenarios above, where relevant variants in the gene were seen in at least four probands, of which at least two were cases (we would not follow up associations signals driven by single cases/families in the first instance). Only gene-based enrichments that were more frequent in cases than controls (putative disease-causing as opposed to protective) were considered in the statistical correction for multiple testing. The Benjamini and Hochberg method52 was used to correct for multiple testing; an overall FDR-adjusted P value threshold of 0.5% was used for claiming statistically significant disease–gene associations for further triaging.
Triaging
First in silico triage
The statistically significant associations were further filtered for those where (1) the gene was protein-coding as the Exomiser coding variant filtering settings also identified variants disrupting non-protein-coding RNA genes (gene type definitions from the human gene nomenclature committee (HGNC) website); (2) for dominant, LoF signals there was gnomAD evidence for haplo-insufficiency (gnomAD v.2.1.1 observed/expected LoF less than 0.5) and (3) none of the cases driving the signal were already assigned a molecular diagnosis in other genes as part of the 100KGP routine diagnostic pipeline.
Application of ClinGen framework for gene–disease validity
Classification of the disease–gene associations according to ClinGen criteria (https://clinicalgenome.org/docs/gene-disease-validity-standard-operating-procedures-version-10/) was applied using in silico approaches where possible. The case-level variant score was calculated from scoring and summing all case variants that support a particular mode of inheritance for a disease–gene association. LoF variants (stop gain, frameshift or splice acceptor/donor) scored 1.5 points or 2 if de novo, whereas others scored 0.1 points or 0.5 if de novo. A case–control study score of 5 points for an odds ratio greater than 5, 4 points for odds ratio greater than 3 or 3 points for odds ratio less than 3 was assigned. The larger of the case-level variant score or case–control study score was used as the genetic evidence score, capped at a maximum of 12 for those associations that had many supporting case variants. Experimental evidence categories were calculated using a variety of sources. Existing evidence for a gene function fitting the likely disease mechanism was assessed using PubMed searches using the disease and gene name and the background knowledge of the experts in the various disease-specific GeCIPs. Scores of 0, 1 or 2 were awarded depending on whether there was no, some tenuous or lots of evidence. Gene expression was assessed using GTEx Project data through the web portal of the Human Protein Atlas (https://www.proteinatlas.org/ (ref. 53); and/or publicly available relevant RNA-seq datasets34,35 processed with STAR v.2.7.6a and Salmon v.1.4.0, and a score of 0, 1 or 2 assigned for no, widespread or solely specific expression in the relevant disease tissue. Defaults of one point for protein–protein association evidence (high quality, direct experimental interactions scoring greater than 0.7 in StringDB with genes on the disease panel from PanelApp16) and 2 points for mouse/zebrafish evidence (phenotypic similarity as calculated by Exomiser between the patient’s phenotypes and the mouse/zebrafish phenotypes where the orthologous gene was disrupted) were used. The rounded sum of genetic and experimental evidence points was used to assign the final ClinGen classification of the evidence for the association as being limited (0.1–6 points), moderate (7–11 points) or strong (12–18 points). Definitive evidence for an association is considered to be a score of 12–18 as well as convincing replication of the result in more than two publications over more than 3 years. Therefore, none of our associations will be classified as definitive at this early stage.
Visual representation of variant location in lollipop plots
Visual representations of the variant locations in the protein were generated by extending the Mutplot software54. The x axis represents the amino acid chain and its annotated protein domain from UniProt. Each lolly indicates a variant by its protein change annotated on the MANE Select transcript or MANE Plus Clinical if a stronger impact is predicted (the transcript used is specified in the plot) and the frequency is shown on the y axis. Its shape indicates the genotype found in the proband. The colour indicates the type of variant and the variant’s functional annotation. If the variant has both a p. change annotation and a number in parenthesis it means that the original p. change was annotated on a different transcript and the amino acid position in parenthesis indicates the re-annotation on the selected transcript. If the only annotation available indicates a number in parenthesis it means that the variant was in the non-coding region for that transcript; therefore, the lolly was placed on the closest amino acid.
PhenoDigm patient similarity comparisons
During the assessment of some disease–gene associations, the phenotypic similarity between the probands driving the signal was calculated using their HPO term annotations and the Exomiser API to give a PhenoDigm55 score between 0 and 1. The mean of the pairwise, reciprocal, non-self hits was calculated and compared with those obtained from 1,000 iterations when the same number of probands was selected at random from the set of cases with that disease.
Co-expression network analysis
Co-expression network analysis of our candidate genes and known genes linked to the potentially associated disease (green genes in PanelApp v.1.120) was performed using GTEx v.6 tissue-specific modules and the CoExp tool accessible at https://rytenlab.com/coexp (ref. 56).
Peripheral blood mononuclear cell expression analysis
RNA-seq data from peripheral blood mononuclear cells collected from three volunteer donors was analysed (poly A-selected libraries, mean of two replicates untreated and two replicates treated with cycloheximide for 1 h to inhibit protein translation and mimic integrated stress response)57. In-house, R was used for DeSeq2 normalizations per library and calculation of the mean values for each transcript for the two replicate libraries per donor per condition. For global evaluations, across all three donors, the mean base value, log2 fold change post cycloheximide and Benjamini–Hochberg adjusted P value were then calculated.
Gene and variant look-up in independent rare disease cohorts
In a cohort of patients from the Irish Kidney Gene Project58 (278 cystic kidney disease and 141 chronic kidney disease cases), rare (gnomAD minor allele frequency less than 0.1%) LoF, missense, splicing or intronic variants were extracted for our new renal disease-associated genes. A further cohort of more than 3,000 Dutch renal patients was queried for likely pathogenic/pathogenic variants in those genes using the Alissa bioinformatics pipeline. Similarly, a sequencing cohort of 212 participants with inherited corneal diseases, recruited in the United Kingdom and Czech Republic and pre-screened for known genetic causes, was interrogated for any rare variants in the candidate gene POMK.
Reporting summary
Further information on research design is available in the Nature Portfolio Reporting Summary linked to this article.