
A recent study by researchers at the University of Toronto Mississauga offers a more precise way to map urban air temperatures, which could help cities better understand local heat patterns and their potential effects.
The method? Pedal-powered science.
Ph.D. student and GIS researcher Scarlett Rakowska biked through the streets of Mississauga collecting air temperature data to track shifts in heat from one neighborhood to the next. Her goal was to test whether mobile monitoring could capture subtle differences that traditional weather stations might miss.
Her research, published in Urban Climate last fall, turned two-wheeled temperature readings into detailed maps revealing small but important variations in heat levels across the city—especially in areas shaped by land use and social factors.
“Cycling is a flexible monitoring technique because it allows for sampling a wide range of land-use environments, providing richer data on heat levels in different parts of the city,” says Rakowska, who co-authored the study with her supervisor, Matthew Adams, an associate professor in the department of geography, geomatics and environment.
In sprawling cities like Mississauga, paved and built-up areas hold more heat than greener ones, making some neighborhoods significantly warmer than others. As climate change drives more extreme temperatures, city planners need a fine-tuned understanding of where heat hits hardest to limit the growing risks to public health and the environment, Rakowska says.
Even modest variations in air temperature can impact people’s day-to-day experience of heat, says Rakowska. She suspected some of these differences might be too subtle or scattered to be detected by a stationary, remote monitoring site, like the city’s lone weather station near Pearson Airport.
To get a fuller picture, she put rubber to the road—literally.
. DOI: 10.1016/j.uclim.2024.102136")
In the summer of 2022, Rakowska cycled seven fixed routes through Mississauga, covering a mix of residential, commercial, industrial and green space areas. She rode each route four times—clockwise and counter-clockwise, morning and afternoon—over 28 days, logging more than 500 kilometers.
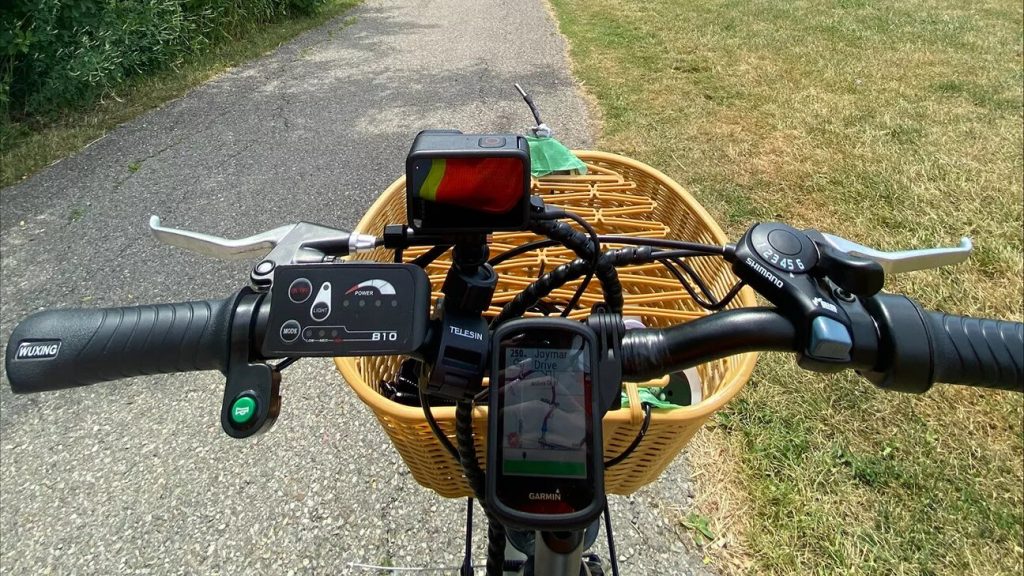
Her bike was fitted with a sensor and GPS to log readings every minute, collecting 3,144 minutes of data across the city. And unlike a car, it didn’t add heat to the environment she was trying to measure.
The results showed that her mobile approach captured more variation in air temperature than a stationary monitor could. She used that data and spatial modeling techniques to produce high-resolution maps offering a hyper-local view of how heat is distributed.
The maps highlighted some striking patterns. Industrial and commercial areas were consistently the hottest, while greener neighborhoods and those near Lake Ontario tended to stay cooler. The study also found that areas with higher levels of marginalization—especially those with housing instability and large newcomer populations—experienced different air temperatures than less marginalized areas.
Rakowska shared her findings at a workshop that included City of Mississauga staff. She hopes the research prompts planners to take a closer look at how air temperature differences could shape the city’s future.
“I hope that as city planners make land-use decisions, this study helps them better understand how different temperatures across the city affect quality of life,” says Rakowska, whose current research focuses on mapping green space across the GTA to better understand its relationship to diabetes and other chronic diseases.
“The data can help planners better organize the city in ways that prioritize residents and the environment.”
More information:
Scarlett B. Rakowska et al, Modelling the microscale spatial distribution of urban air temperature in suburban sprawl, Urban Climate (2024). DOI: 10.1016/j.uclim.2024.102136
Provided by
University of Toronto Mississauga
Citation:
Hot wheels: Researcher cycles through Mississauga to map air temperature differences across the city (2025, March 28)
retrieved 28 March 2025
from https://phys.org/news/2025-03-hot-wheels-mississauga-air-temperature.html
This document is subject to copyright. Apart from any fair dealing for the purpose of private study or research, no
part may be reproduced without the written permission. The content is provided for information purposes only.